Developing the Multimodal Graph – ‘Data-Driven Engine’
This outcome focuses on the development of a visual language for AI’s emotional interpretation. Using the concept of a ‘Data-Driven Engine,’ it highlights how AI uses data to process and map emotions, blending auditory and visual elements to represent this process.”
Visual Outcomes
Tools used to Visually interpret AI's Emotional Comprehension
- Hume AI: Analysing speech prosody to detect emotions in language.
- Poe: Interpreting emotions through shapes.
- Stable Audio: Translating emotional tones into sound.
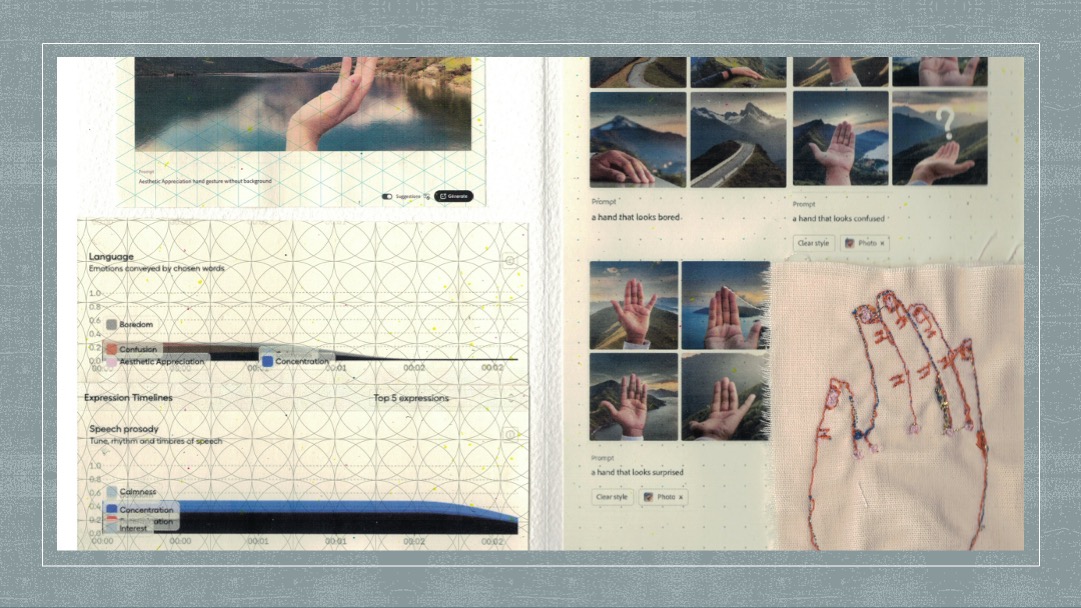
- AI Generative Tools: Exploring hand gesture interpretations through various AI models.
Future Exploration
At this stage, I was really keen on creating something that looked more scientific—a graph that would clearly map each emotion to its corresponding hand gesture. But I was still frustrated with the projection mapping. I wanted to keep some animation in the mix, so I decided to animate each of the hand gestures, as if they were part of a diagram in a digital world. The result was a bit eerie, but also fascinating. I started imagining how this could work in a digital space—what if a sound triggered when you swiped a still hand, and it came to life in animation? That would add a whole new level of interactivity. But honestly, my coding skills were pretty minimal at that point, and it felt too complex to pull off. So, I decided to take a step back, keep it simple, and focus on sketchbooks, film outcomes, and the touchboard with sound effects.”